DAY 1 -AZURE DP900(Microsoft Azure Data Fundamentals: Explore core data concepts)
Introduction
Over the last few decades, the amount of data that systems, applications, and devices have generated has increased significantly. Data is everywhere. Data is available in different structures and formats. Understanding data and exploring it reveals interesting facts, and helps you gain meaningful insights.
In this module, you'll learn about how you can organize and process data. You'll learn about relational and non-relational databases, and how data is handled through transactional processing, and through batch and streaming data processing.
To consider how the tools and techniques learnt can be applied in real world scenarios, imagine you're a data analyst for a large consumer organization. The organization wants to understand customer buying patterns from supermarkets. The organization has a number of datasets from different sources, such as till information (point of sale), weather data, and holiday data. The organization would like to use Azure technologies to understand and analyze these datasets. This scenario will be used throughout the module.
Learning objectives
In this module you will:
- Identify how data is defined and stored
- Identify characteristics of relational and non-relational data
- Describe and differentiate data workloads
- Describe and differentiate batch and streaming data
Identify the need for data solutions
Data is now easier to collect and cheaper to host, making it accessible to nearly every business. Data solutions include software technologies and platforms that can help facilitate the collection, analysis, and storage of valuable information. Every business would like to grow their revenues and make larger profits. In this competitive market, data is a valuable asset. When analyzed properly, data provides a wealth of useful information and inform critical business decisions.
What is data?
Data is a collection of facts such as numbers, descriptions, and observations used in decision making. You can classify data as structured, semi-structured, or unstructured.
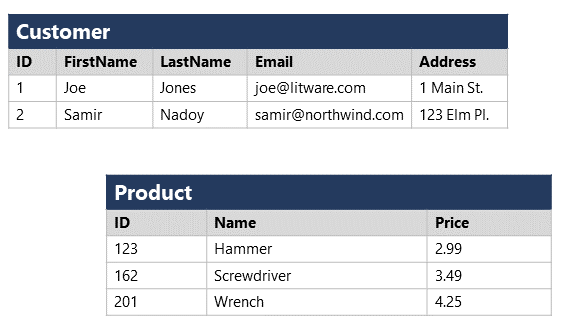
Structured data is typically tabular data that is represented by rows and columns in a database. Databases that hold tables in this form are called relational databases (the mathematical term relation refers to an organized set of data held as a table). Each row in a table has the same set of columns. The image below illustrates an example showing two tables in an ecommerce database. The first table contains the details of customers for an organization, and the second holds information about products that the organization sells.
Semi-structured data is information that doesn't reside in a relational database but still has some structure to it. Examples include documents held in JavaScript Object Notation (JSON) format. The example below shows a pair of documents representing customer information. In both cases, each customer document includes child documents containing the name and address, but the fields in these child documents vary between customers.
## Document 1 ##
{
  "customerID": "103248",
  "name":
  {
    "first": "AAA",
    "last": "BBB"
  },
  "address":
  {
    "street": "Main Street",
    "number": "101",
    "city": "Acity",
    "state": "NY"
  },
  "ccOnFile": "yes",
  "firstOrder": "02/28/2003"
}

## Document 2 ##
{
  "customerID": "103249",
  "name":
  {
    "title": "Mr",
    "forename": "AAA",
    "lastname": "BBB"
  },
  "address":
  {
    "street": "Another Street",
    "number": "202",
    "city": "Bcity",
    "county": "Gloucestershire",
    "country-region": "UK"
  },
  "ccOnFile": "yes"
}
There are other types of semi-structured data as well. Examples include key-value stores and graph databases.
A key-value database stores Associative arrays. In those arrays, a Key serves as a unique identifier to retrieve a specific value. Those values can be anything from a number or a string to a complex object, like a JSON file.
A key-value database stores data as a single collection without structure or relation. That makes them different to a relational database where tables are made up of rows and columns with predefined data types.
The image below shows an example of key-value data.

You can use a graph database to store and query information about complex relationships. A graph contains nodes (information about objects), and edges (information about the relationships between objects). The image below shows an example of how you might structure the data in a graph database.

Not all data is structured or even semi-structured. For example, audio and video files, and binary data files might not have a specific structure. They're referred to as unstructured data.
How is data defined, stored, and accessed in cloud computing?
Depending on the type of data such as structured, semi-structured, or unstructured, data will be stored differently. Structured data is typically stored in a relational database such as SQL Server or Azure SQL Database. Azure SQL Database is a service that runs in the cloud. You can use it to create and access relational tables. The service is managed and run by Azure, you just specify that you want a database server to be created. The act of setting up the database server is called provisioning.
You can provision other services as well in Azure. For example, if you want to store unstructured data such as video or audio files, you can use Azure Blob storage (Blob is an acronym for Binary Large Object). If you want to store semi-structured data such as documents, you can use a service such as Azure Cosmos DB.
After your service is provisioned, the service needs to be configured so that users can be given access to the data. You can typically define several levels of access.
Read-only access means the users can read data but can't modify any existing data or create new data.
Read/write access gives users the ability to view and modify existing data.
Owner privilege gives full access to the data including managing the security like adding new users and removing access to existing users.
You can also define which users should be allowed to access the data in the first place. If the data is sensitive (or secret), you may want to restrict access to a few select users.
In the example where you're a data analyst for a large consumer organization you have decided to give read-only access to the whole management team. The management team have no need to modify data, but have security clearance to see any data. Read-write access is given to the app that salespeople use to record sales. The individual users won't need to access the system directly, but will make edits via their app. Data analysts and data managers will have owner privileges because they need to manage the access of other users and administer the system.
Describe data processing solutions
Data processing solutions often fall into one of two broad categories: analytical systems, and transaction processing systems.
What is a transactional system?
A transactional system is often what most people consider the primary function of business computing. A transactional system records transactions. A transaction could be financial, such as the movement of money between accounts in a banking system, or it might be part of a retail system, tracking payments for goods and services from customers. Think of a transaction as a small, discrete, unit of work.
Transactional systems are often high-volume, sometimes handling many millions of transactions in a single day. The data being processed has to be accessible very quickly. The work performed by transactional systems is often referred to as Online Transactional Processing (OLTP).
To support fast processing, the data in a transactional system is often divided into small pieces. For example, if you're using a relational system each table involved in a transaction only contains the columns necessary to perform the transactional task. In the bank transfer example, a table holding information about the funds in the account might only contain the account number and the current balance. Other tables not involved in the transfer operation would hold information such as the name and address of the customer, and the account history. Splitting tables out into separate groups of columns like this is called normalization. The next unit discusses this process in more detail. Normalization can enable a transactional system to cache much of the information required to perform transactions in memory, and speed throughput.
While normalization enables fast throughput for transactions, it can make querying more complex. Queries involving normalized tables will frequently need to join the data held across several tables back together again. This can make it difficult for business users who might need to examine the data.
What is an analytical system?
In contrast to systems designed to support OLTP, an analytical system is designed to support business users who need to query data and gain a big picture view of the information held in a database.
Analytical systems are concerned with capturing raw data, and using it to generate insights. An organization can use these insights to make business decisions. For example, detailed insights for a manufacturing company might indicate trends enabling them to determine which product lines to focus on, for profitability.
Most analytical data processing systems need to perform similar tasks: data ingestion, data transformation, data querying, and data visualization. The image below illustrates the components in a typical data processing system.

Data Ingestion: Data ingestion is the process of capturing the raw data. This data could be taken from control devices measuring environmental information such as temperature and pressure, point-of-sale devices recording the items purchased by a customer in a supermarket, financial data recording the movement of money between bank accounts, and weather data from weather stations. Some of this data might come from a separate OLTP system. To process and analyze this data, you must first store the data in a repository of some sort. The repository could be a file store, a document database, or even a relational database.
Data Transformation/Data Processing: The raw data might not be in a format that is suitable for querying. The data might contain anomalies that should be filtered out, or it may require transforming in some way. For example, dates or addresses might need to be converted into a standard format. After data is ingested into a data repository, you may want to do some cleaning operations and remove any questionable or invalid data, or perform some aggregations such as calculating profit, margin, and other Key Performance Indicators (KPIs). KPIs are how businesses are measured for growth and performance.
Data Querying: After data is ingested and transformed, you can query the data to analyze it. You may be looking for trends, or attempting to determine the cause of problems in your systems. Many database management systems provide tools to enable you to perform ad-hoc queries against your data and generate regular reports.
Data Visualization: Data represented in tables such as rows and columns, or as documents, aren't always intuitive. Visualizing the data can often be useful as a tool for examining data. You can generate charts such as bar charts, line charts, plot results on geographical maps, pie charts, or illustrate how data changes over time. Microsoft offers visualization tools like Power BI to provide rich graphical representation of your data.
Identify types of data and data storage
You can categorize data in many different ways, depending not only on how it's structured, but also on how the data is used. In this unit, you'll learn about the characteristics of different types of data.
Describe the characteristics of relational and non-relational data
Relational databases provide probably the most well-understood model for holding data. The simple structure of tables and columns makes them easy to use initially, but the rigid structure can cause some problems. For example, in a database holding customer information, how do you handle customers that have more than one address? Do you add columns to hold the details for each address? If so, how many of these columns should you add? If you allow for three addresses, what happens if a customer has only one address? What do you store in the spare columns? What then happens if you suddenly have a customer with four addresses? Similarly, what information do you store in an address (street name, house number, city, zip code)? What happens if a house has a name rather than a number, or is located somewhere that doesn't use zip codes?
You can solve these problems by using a process called normalization. Typically, the end result of the normalization process is that your data is split into a large number of narrow, well-defined tables (a narrow table is a table with few columns), with references from one table to another, as shown in the image below. However, querying the data often requires reassembling information from multiple tables by joining the data back together at run-time (illustrated by the lines in the diagram). These types of queries can be expensive.

Non-relational databases enable you to store data in a format that more closely matches the original structure. For example, in a document database, you could store the details of each customer in a single document, as shown by the example in the previous unit. Retrieving the details of a customer, including the address, is a matter of reading a single document. There are some disadvantages to using a document database though. If two customers cohabit and have the same address, in a relational database you would only need to store the address information once. In the diagram below, Jay and Frances Adams both share the same address.

In a document database, the address would be duplicated in the documents for Jay and Francis Adams. This duplication not only increases the storage required, but can also make maintenance more complex (if the address changes, you must modify it in two documents).
## Document for Jay Adams ##
{
  "customerID": "1",
  "name":
  {
    "firstname": "Jay",
    "lastname": "Adams"
  },
  "address":
  {
    "number": "12",
    "street": "Park Street",
    "city": "Some City",
  }
}

## Document for Frances Adams ##
{
  "customerID": "4",
  "name":
  {
    "firstname": "Francis",
    "lastname": "Adams"
  },
  "address":
  {
    "number": "12",
    "street": "Park Street",
    "city": "Some City",
  }
}
Describe transactional workloads
Relational and non-relational databases are suited to different workloads. A primary use of relational databases is to handle transaction processing.
A transaction is a sequence of operations that are atomic. This means that either all operations in the sequence must be completed successfully, or if something goes wrong, all operations run so far in the sequence must be undone. Bank transfers are a good example; you deduct funds from one account and credit the equivalent funds to another account. If the system fails after deducting the funds, they must be reinstated in the original account (they mustn't be lost). You can then attempt to perform the transfer again. Similarly, you shouldn't be able to credit an account twice with the same funds.
Each database transaction has a defined beginning point, followed by steps to modify the data within the database. At the end, the database either commits the changes to make them permanent, or rolls back the changes to the starting point, when the transaction can be tried again.
A transactional database must adhere to the ACID (Atomicity, Consistency, Isolation, Durability) properties to ensure that the database remains consistent while processing transactions.
Atomicity guarantees that each transaction is treated as a single unit, which either succeeds completely, or fails completely. If any of the statements constituting a transaction fails to complete, the entire transaction fails and the database is left unchanged. An atomic system must guarantee atomicity in each and every situation, including power failures, errors, and crashes.
Consistency ensures that a transaction can only take the data in the database from one valid state to another. A consistent database should never lose or create data in a manner that can't be accounted for. In the bank transfer example described earlier, if you add funds to an account, there must be a corresponding deduction of funds somewhere, or a record that describes where the funds have come from if they have been received externally. You can't suddenly create (or lose) money.
Isolation ensures that concurrent execution of transactions leaves the database in the same state that would have been obtained if the transactions were executed sequentially. A concurrent process can't see the data in an inconsistent state (for example, the funds have been deducted from one account, but not yet credited to another.)
Durability guarantees that once a transaction has been committed, it will remain committed even if there's a system failure such as a power outage or crash.
Database systems that process transactional workloads are inherently complex. They need to manage concurrent users possibly attempting to access and modify the same data at the same time, processing the transactions in isolation while keeping the database consistent and recoverable. Many systems implement relational consistency and isolation by applying locks to data when it is updated. The lock prevents another process from reading the data until the lock is released. The lock is only released when the transaction commits or rolls back. Extensive locking can lead to poor performance, while applications wait for locks to be released.
Distributed databases are widely used in many organizations. A distributed database is a database in which data is stored across different physical locations. It may be held in multiple computers located in the same physical location (for example, a datacenter), or may be dispersed over a network of interconnected computers. When compared to non-distributed database systems, any data update to a distributed database will take time to apply across multiple locations. If you require transactional consistency in this scenario, locks may be retained for a very long time, especially if there's a network failure between databases at a critical point in time. To counter this problem, many distributed database management systems relax the strict isolation requirements of transactions and implement "eventual consistency." In this form of consistency, as an application writes data, each change is recorded by one server and then propagated to the other servers in the distributed database system asynchronously. While this strategy helps to minimize latency, it can lead to temporary inconsistencies in the data. Eventual consistency is ideal where the application doesn't require any ordering guarantees. Examples include counts of shares, likes, or non-threaded comments in a social media system.
Describe analytical workloads
Analytical workloads are typically read-only systems that store vast volumes of historical data or business metrics, such as sales performance and inventory levels. Analytical workloads are used for data analysis and decision making. Analytics are generated by aggregating the facts presented by the raw data into summaries, trends, and other kinds of “Business information.”
Analytics can be based on a snapshot of the data at a given point in time, or a series of snapshots. Decision makers usually don't require all the details of every transaction. They want the bigger picture.
An example of analytical information is a report on monthly sales. As the head of sales department, you may not need to see all daily transactions that took place (transactional information), but you definitely would like a monthly sales report to identify trends and to make decisions (analytical information).
Transactional information, however, is an integral part of analytical information. If you don't have good records of daily sales, you can't compile a useful report to identify trends. That’s why efficient handling of transactional information is very important.
Describe the difference between batch and streaming data
Data processing is simply the conversion of raw data to meaningful information through a process. Depending on how the data is ingested into your system, you could process each data item as it arrives, or buffer the raw data and process it in groups. Processing data as it arrives is called streaming. Buffering and processing the data in groups is called batch processing.
Understand batch processing
In batch processing, newly arriving data elements are collected into a group. The whole group is then processed at a future time as a batch. Exactly when each group is processed can be determined in a number of ways. For example, you can process data based on a scheduled time interval (for example, every hour), or it could be triggered when a certain amount of data has arrived, or as the result of some other event.
An example of batch processing is the way that votes are typically counted in elections. The votes are not entered when they are cast, but are all entered together at one time in a batch.
Advantages of batch processing include:
- Large volumes of data can be processed at a convenient time.
- It can be scheduled to run at a time when computers or systems might otherwise be idle, such as overnight, or during off-peak hours.
Disadvantages of batch processing include:
- The time delay between ingesting the data and getting the results.
- All of a batch job's input data must be ready before a batch can be processed. This means data must be carefully checked. Problems with data, errors, and program crashes that occur during batch jobs bring the whole process to a halt. The input data must be carefully checked before the job can be run again. Even minor data errors, such as typographical errors in dates, can prevent a batch job from running.
An example of an effective use of batch processing would be a connection to a mainframe system. Vast amounts of data need to be transferred into a data analysis system and the data is not real-time. An example of ineffective batch-processing would be to transfer small amounts of real-time data, such as a financial stock-ticker.
Understand streaming and real-time data
In stream processing, each new piece of data is processed when it arrives. For example, data ingestion is inherently a streaming process.
Streaming handles data in real time. Unlike batch processing, there's no waiting until the next batch processing interval, and data is processed as individual pieces rather than being processed a batch at a time. Streaming data processing is beneficial in most scenarios where new, dynamic data is generated on a continual basis.
Examples of streaming data include:
- A financial institution tracks changes in the stock market in real time, computes value-at-risk, and automatically rebalances portfolios based on stock price movements.
- An online gaming company collects real-time data about player-game interactions, and feeds the data into its gaming platform. It then analyzes the data in real time, offers incentives and dynamic experiences to engage its players.
- A real-estate website that tracks a subset of data from consumers’ mobile devices, and makes real-time property recommendations of properties to visit based on their geo-location.
Stream processing is ideal for time-critical operations that require an instant real-time response. For example, a system that monitors a building for smoke and heat needs to trigger alarms and unlock doors to allow residents to escape immediately in the event of a fire.
Understand differences between batch and streaming data
Apart from the way in which batch processing and streaming processing handle data, there are other differences:
Data Scope: Batch processing can process all the data in the dataset. Stream processing typically only has access to the most recent data received, or within a rolling time window (the last 30 seconds, for example).
Data Size: Batch processing is suitable for handling large datasets efficiently. Stream processing is intended for individual records or micro batches consisting of few records.
Performance: The latency for batch processing is typically a few hours. Stream processing typically occurs immediately, with latency in the order of seconds or milliseconds. Latency is the time taken for the data to be received and processed.
Analysis: You typically use batch processing for performing complex analytics. Stream processing is used for simple response functions, aggregates, or calculations such as rolling averages.

Comments
Post a Comment