DAY 5 -AZURE DP900(Explore concepts of data analytics)
Describe data ingestion and processing
Data analytics is concerned with taking data and finding meaningful information and inferences from it. This could be as wide ranging as selecting the ideal range of products for a retailer, or selecting the best vaccine candidates for a biotechnology company.
For example, in a company data analytics could be concerned with taking the data that your organization produces, and using it to establish a picture of how your organization is performing, and what you can do to maintain business performance. Data analytics could help you to identify strengths and weaknesses in your organization, and enable you to make appropriate business decisions.
The data a company uses can come from many sources. There could be a mass of historical data to comb through, and fresh data continuing to arrive all the time. This data could be the result of customer purchases, bank transactions, stock price movements, real-time weather data, monitoring devices, or even cameras. In a data analytics solution, you combine this data and construct a data warehouse that you can use to ask (and answer) questions about your business operations. Building a data warehouse requires that you can capture the data that you need and wrangle it into an appropriate format. You can then use analysis tools and visualizations to examine the information, and identify trends and their causes.
Note
Wrangling is the process by which you transform and map raw data into a more useful format for analysis. It can involve writing code to capture, filter, clean, combine, and aggregate data from many sources.
In this unit, you'll learn about two important stages in data analytics: data ingestion, and data processing. The diagram below shows how these stages fit together.

What is data ingestion?
Data ingestion is the process of obtaining and importing data for immediate use or storage in a database. The data can arrive as a continuous stream, or it may come in batches, depending on the source. The purpose of the ingestion process is to capture this data and store it. This raw data can be held in a repository such as a database management system, a set of files, or some other type of fast, easily accessible storage.
The ingestion process might also perform filtering. For example, ingestion might reject suspicious, corrupt, or duplicated data. Suspicious data might be data arriving from an unexpected source. Corrupt or duplicated data could be due to a device error, transmission failure, or tampering.
It may also be possible to perform some transformations at this stage, converting data into a standard form for later processing. For example, you might want to reformat all date and time data to use the same date and time representations, and convert all measurement data to use the same units. However, these transformations must be quick to perform. Don't attempt to run any complex calculations or aggregations on the data at this stage.
What is data processing?
The data processing stage occurs after the data has been ingested and collected. Data processing takes the data in its raw form, cleans it, and converts it into a more meaningful format (tables, graphs, documents, and so on). The result is a database of data that you can use to perform queries and generate visualizations, giving it the form and context necessary to be interpreted by computers and used by employees throughout an organization.
Note
Data cleaning is a generalized term that encompasses a range of actions, such as removing anomalies, and applying filters and transformations that would be too time-consuming to run during the ingestion stage.
The aim of data processing is to convert the raw data into one or more business models. A business model describes the data in terms of meaningful business entities, and may aggregate items together and summarize information. The data processing stage could also generate predictive or other analytical models from the data. Data processing can be complex, and may involve automated scripts, and tools such as Azure Databricks, Azure Functions, and Azure Cognitive Services to examine and reformat the data, and generate models. A data analyst could use machine learning to help determine future trends based on these models.

What is ELT and ETL?
The data processing mechanism can take two approaches to retrieving the ingested data, processing this data to transform it and generate models, and then saving the transformed data and models. These approaches are known as ETL and ELT.
ETL stands for Extract, Transform, and Load. The raw data is retrieved and transformed before being saved. The extract, transform, and load steps can be performed as a continuous pipeline of operations. It is suitable for systems that only require simple models, with little dependency between items. For example, this type of process is often used for basic data cleaning tasks, deduplicating data, and reformatting the contents of individual fields.

An alternative approach is ELT. ELT is an abbreviation of Extract, Load, and Transform. The process differs from ETL in that the data is stored before being transformed. The data processing engine can take an iterative approach, retrieving and processing the data from storage, before writing the transformed data and models back to storage. ELT is more suitable for constructing complex models that depend on multiple items in the database, often using periodic batch processing.

ELT is a scalable approach that is suitable for the cloud because it can make use of the extensive processing power available. The more stream-oriented approach of ETL places more emphasis on throughput. However, ETL can filter data before it's stored. In this way, ETL can help with data privacy and compliance, removing sensitive data before it arrives in your analytical data models.
Azure provides several options that you can use to implement the ELT and ETL approaches. For example, if you are storing data in Azure SQL Database, you can use SQL Server Integration Services. Integration Services can extract and transform data from a wide variety of sources such as XML data files, flat files, and relational data sources, and then load the data into one or more destinations.
This is a simple table showing the advantages of ETL and ELT in most cases.

Another more generalized approach is to use Azure Data Factory. Azure Data Factory is a cloud-based data integration service that allows you to create data-driven workflows for orchestrating data movement and transforming data at scale. Using Azure Data Factory, you can create and schedule data-driven workflows (called pipelines) that can ingest data from disparate data stores. You can build complex ETL processes that transform data visually with data flows, or by using compute services such as Azure HDInsight Hadoop, Azure Databricks, and Azure SQL Database.
Explore data visualization
A business model can contain an enormous amount of information. The purpose of producing a model such as this is to help you reason over the information it contains, ask questions, and hopefully obtain answers that can help you drive your business forward.
This unit discusses some of the techniques you can use to analyze and understand the information in your models.
What is reporting?
Reporting is the process of organizing data into informational summaries to monitor how different areas of an organization are performing. Reporting helps companies monitor their online business, and know when data falls outside of expected ranges. Good reporting should raise questions about the business from its end users. Reporting shows you what has happened, while analysis focuses on explaining why it happened and what you can do about it.
What is business intelligence?
The term Business Intelligence (BI) refers to technologies, applications, and practices for the collection, integration, analysis, and presentation of business information. The purpose of business intelligence is to support better decision making.
Business intelligence systems provide historical, current, and predictive views of business operations, most often using data that has been gathered into a data warehouse, and occasionally working from live operational data. Software elements support reporting, interactive “slice-and-dice” pivot table analysis, visualization, and statistical data mining. Applications tackle sales, production, financial, and many other sources of business data for purposes that include business performance management. Information is often gathered about other companies in the same industry for comparison. This process of comparison with other companies in the same industry is known as benchmarking.
What is data visualization?
Data visualization is the graphical representation of information and data. By using visual elements like charts, graphs, and maps, data visualization tools provide an accessible way to spot and understand trends, outliers, and patterns in data. If you are using Azure, the most popular data visualization tool is Power BI.
Using Power BI, you can connect to multiple different sources of data, and combine them into a data model. This data model lets you build visuals, and collections of visuals you can share as reports, with other people inside your organization.
Explore visualization options to represent data
Data visualization helps you to focus on the meaning of data, rather than looking at the data itself. A good data visualization enables you to quickly spot trends, anomalies, and potential issues. The most common forms of visualizations are:
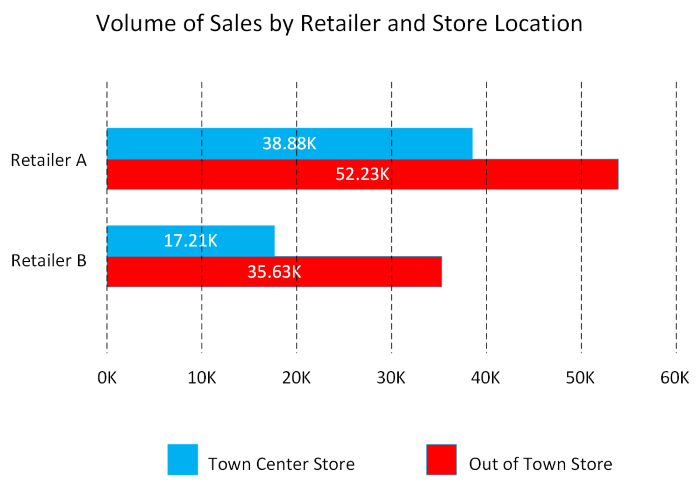
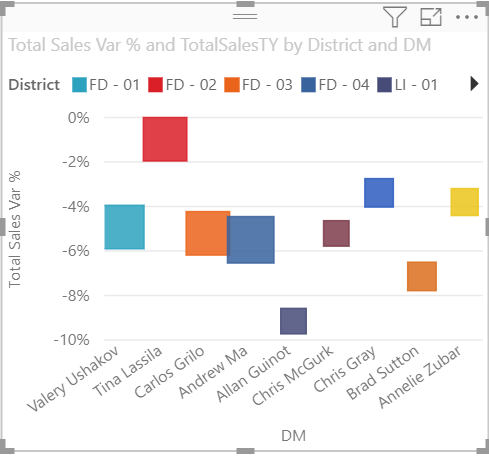
Bar and column charts: Bar and column charts enable you to see how a set of variables changes across different categories. For example, the first chart below shows how sales for a pair of fictitious retailers vary between store sites.
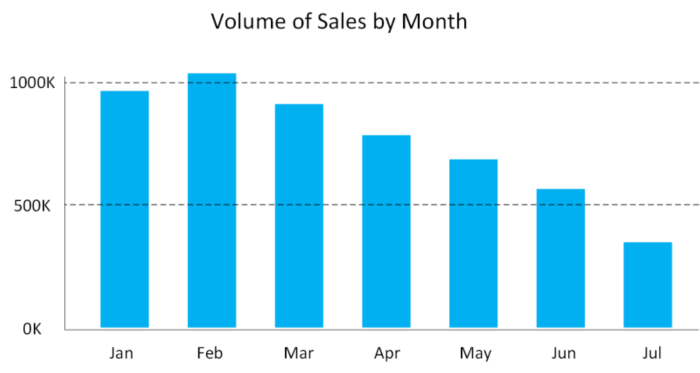
This chart shows how sales vary by month.
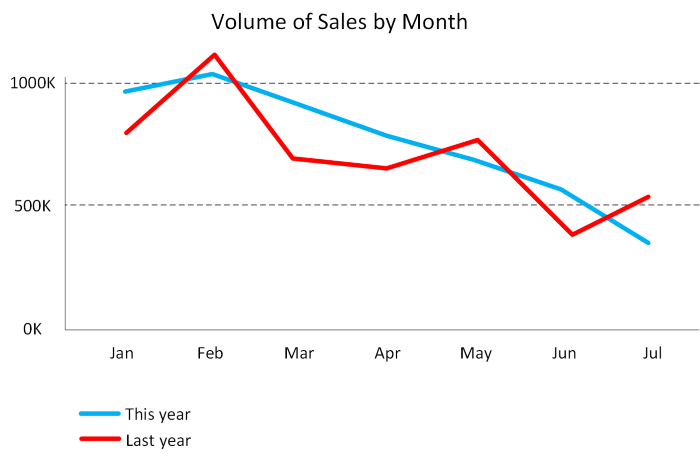
Line charts: Line charts emphasize the overall shape of an entire series of values, usually over time.
Matrix: A matrix visual is a tabular structure that summarizes data. Often, report designers include matrixes in reports and dashboards to allow users to select one or more element (rows, columns, cells) in the matrix to cross-highlight other visuals on a report page.

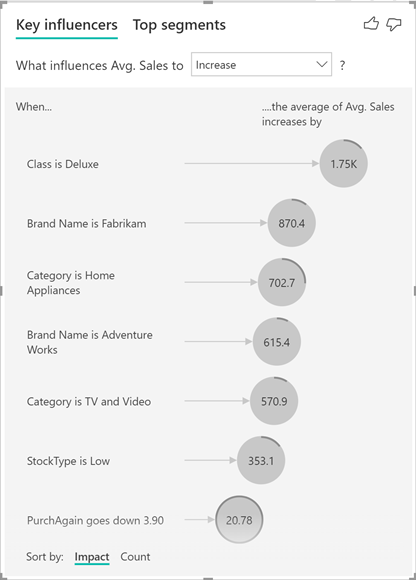
Key influencers: A key influencer chart displays the major contributors to a selected result or value. Key influencers are a great choice to help you understand the factors that influence a key metric. For example, what influences customers to place a second order or why sales were so high last June.
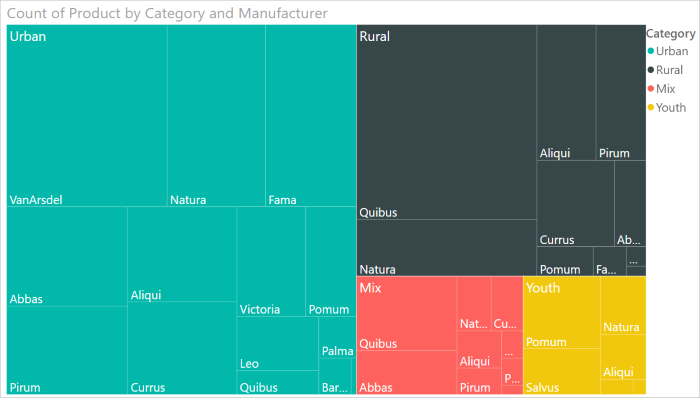
Treemap: Treemaps are charts of colored rectangles, with size representing the relative value of each item. They can be hierarchical, with rectangles nested within the main rectangles.
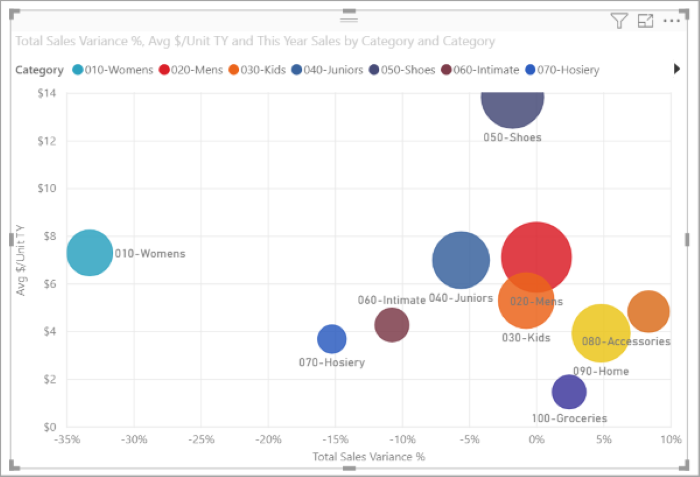
Scatter: A scatter chart shows the relationship between two numerical values. A bubble chart is a scatter chart that replaces data points with bubbles, with the bubble size representing an additional third data dimension.
A dot plot chart is similar to a bubble chart and scatter chart, but can plot categorical data along the X-Axis.
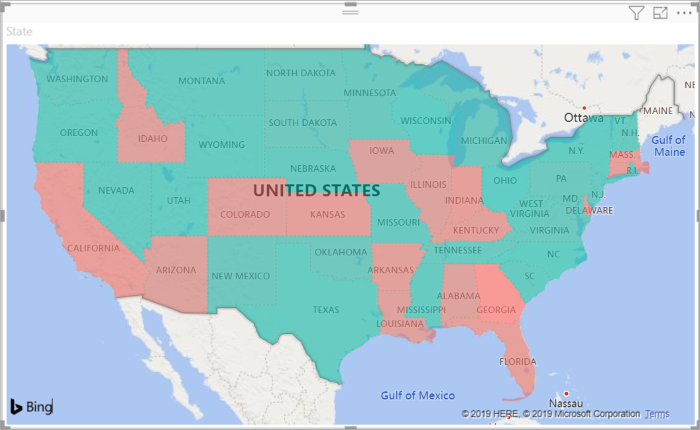
Filled map. If you have geographical data, you can use a filled map to display how a value differs in proportion across a geography or region. You can see relative differences with shading that ranges from light (less-frequent/lower) to dark (more-frequent/more).
Explore data analytics
Data analytics is concerned with examining, transforming, and arranging data so that you can study it and extract useful information. Data analytics is a discipline that covers the entire range of data management tasks. These tasks not only include analysis, but also data collection, organization, storage, and all the tools and techniques used.
The term data analytics is a catch-all that covers a range of activities, each with its own focus and goals. You can categorize these activities as descriptive, diagnostic, predictive, prescriptive, and cognitive analytics.

In this unit, you'll learn about these categories of data analytics.
Descriptive analytics
Descriptive analytics helps answer questions about what has happened, based on historical data. Descriptive analytics techniques summarize large datasets to describe outcomes to stakeholders.
By developing KPIs (Key Performance Indicators), these strategies can help track the success or failure of key objectives. Metrics such as return on investment (ROI) are used in many industries. Specialized metrics are developed to track performance in specific industries.
Examples of descriptive analytics include generating reports to provide a view of an organization's sales and financial data.
Diagnostic analytics
Diagnostic analytics helps answer questions about why things happened. Diagnostic analytics techniques supplement more basic descriptive analytics. They take the findings from descriptive analytics and dig deeper to find the cause. The performance indicators are further investigated to discover why they got better or worse. This generally occurs in three steps:
- Identify anomalies in the data. These may be unexpected changes in a metric or a particular market.
- Collect data that's related to these anomalies.
- Use statistical techniques to discover relationships and trends that explain these anomalies.
Predictive analytics
Predictive analytics helps answer questions about what will happen in the future. Predictive analytics techniques use historical data to identify trends and determine if they're likely to recur. Predictive analytical tools provide valuable insight into what may happen in the future. Techniques include a variety of statistical and machine learning techniques such as neural networks, decision trees, and regression.
Prescriptive analytics
Prescriptive analytics helps answer questions about what actions should be taken to achieve a goal or target. By using insights from predictive analytics, data-driven decisions can be made. This technique allows businesses to make informed decisions in the face of uncertainty. Prescriptive analytics techniques rely on machine learning strategies to find patterns in large datasets. By analyzing past decisions and events, the likelihood of different outcomes can be estimated.
Cognitive analytics
Cognitive analytics attempts to draw inferences from existing data and patterns, derive conclusions based on existing knowledge bases, and then add these findings back into the knowledge base for future inferences--a self-learning feedback loop. Cognitive analytics helps you to learn what might happen if circumstances change, and how you might handle these situations.
Inferences aren't structured queries based on a rules database, rather they're unstructured hypotheses gathered from a number of sources, and expressed with varying degrees of confidence. Effective cognitive analytics depends on machine learning algorithms. It uses several NLP (Natural Language Processing) concepts to make sense of previously untapped data sources, such as call center conversation logs and product reviews.
Theoretically, by tapping the benefits of massive parallel/distributed computing and the falling costs of data storage and computing power, there's no limit to the cognitive development that these systems can achieve.

Comments
Post a Comment